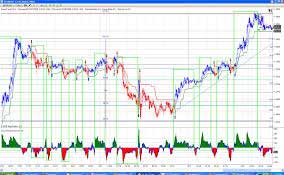
A trading system is a set of rules and conditions that generate buy and sell signals without any human interference.
As technology advances, so does the trading industry. Since the new millennium, automated trading has witnessed significant growth. The implementation of automated trading strategies has become a common practice for both professional and retail traders. Nowadays, retail traders have access to hundreds of financial markets worldwide using a simple personal computer and an internet connection. Furthermore, building an automated trading system is easier and cheaper than ever.
The Two Approaches
There are many different approaches when categorizing trading systems, however, the two key approaches include:
(1) Model-based systems
(2) Data-driven strategies
Data-driven strategies are complex and require significant resources. Therefore, the focus is on model-based trading systems, which are easier to implement.
Seven (7) Questions When Building any Trading System
Every efficient trading system should incorporate a decision-making module capable of answering the following questions:
-
What assets/markets to trade?
-
What direction to trade (bulls/bears)?
-
When to trade (best price or time)?
-
What is the trading cost (fees, spread, overnight cost)?
-
Are there any hidden risks involved (liquidity risks, correlations with other assets, etc.)?
-
How much to trade (position sizing)?
-
What trading orders should be used (market orders, pending orders, stops)?
-
When or where to sell (target price, price intervals, etc.)?
-
Walk-Through Optimization
Identifying the Market Trend & Identification Systems
 The accurate recognition of a strong Forex market trend can lead to the accumulation of major trading profits. There are two main trend types: the (i) primary, and the (ii) secondary trends:
(I) PRIMARY TREND
The Primary Trend is the major trend in the market. It can last for weeks, months, or even years, and includes several short-term secondary trends. According to the Dow Theory, the primary trend has a strong impact on the secondary/minor trends within the same market.
-
The long-term goals of key central banks, and especially the FED, play a major role in the creation of these primary trends
(II) SECONDARY TREND
A secondary trend is less significant than a primary trend and can last for hours, days, or weeks.
» Identifying the Forex Trend at FxPros.net
Trading Strategies and Categories
There are tens of different trading strategies. You can even combine two or more strategies to build a multi-trading system.
(1) Trend-Following Strategies
A trend refers to the overall direction of the market and consists of three main categories: short-, intermediate, and long-term trends. These are some examples when using technical analysis :
-
Historical support & resistance levels
-
Key trendlines & Price channels
(2) Mean-Reversion Strategies
The Mean-Reversion strategy assumes that the price of a financial asset will revert to its mean price 80% of all times. In other words, 80% of all times markets range. That means extreme highs and lows create good opportunities to sell or buy the market and wait for the price to return to its mean.
-
Using historical data to generate an average asset price and calculating the current price range
-
Breaking the range triggers the execution of a trade
(3) Volatility-Expansion Strategies
There are many different trading strategies based on volatility (volatility expansion, volatility breakouts, etc.). The volatility expansion is a short-term strategy that focuses on sudden changes in volatility in the price of financial assets.
-
Combining market volatility with price metrics
-
The strategy offers a high winning percentage but low profits per trade
(4) Market-Sentiment Strategies
Market sentiment strategies attempt to quantify the investor’s sentiment based on a wide variety of data sources such as:
-
Put/Call Ratio
-
COT report (CBOE)
-
Social Media Measures via data-mining
(5) News-Event Strategies
Automated trading can prove very useful when trading the news. A simple news-event-based strategy may open trade positions based on the difference between actual data and market consensus.
-
Quantifying scheduled/unscheduled news releases and determining the impact
-
Avoiding stop-hunting techniques
Technical Analysis –List of Overlays and Indicators
 Technical Analysis is a set of tools and techniques used either to identify the market trend and/or to identify if the market is trading in overbought or oversold levels. Here are the basic categories and tools of technical analysis traders use worldwide.
-
Overlays
-
Price-based indicators
-
Volume-based indicators
-
Market and Breadth Indicators
» Technical Analysis Overlays and Indicators
Manual Trading for Retail Traders -The Forex Trendy

Forex Trendy is a solution for retail traders who need a simple system to trade Forex. Without using indicators to identify the master trend, Forex Trendy is based on market action. The Forex Trendy can scan 34 currency pairs on multiple time frames that range between 1 minute and 1 month. Forex Trendy can determine the master trend by identifying new chart patterns when they occur. It monitors instantly all available time frames and recognizes pattern break-outs. This is when sound alerts are generated.
-
Trading System Name: Forex Trendy
-
System Type: Trend Scanner & Signaling Machine
-
Signals Delivery: E-mail & Sound Alerts
-
Price: $37 (3-month subscription)
The system can be adapted to the most popular trading platforms such as MetaTrader, TradeStation, and NinjaTrader.
-
Review: » Forex Trendy Review
-
Website: » The Forex Trendy Website
□ Trading Systems
G.P. for CurrenciesFx.com (c) -You are not allowed to copy any content without permission
L MORE on FXPROS.NET • COMPARE • LEARNING • TRADE SYSTEMS
□ Broker Ratings
□ Expert Advisors
□ Forex Brokers
► Getting Started with Forex
► Getting Started with Trading Systems
► How to Choose a Forex Broker
► Getting Started with Algorithmic Trading
► Identifying the Forex Trend
► Overlays and Indicators
► Forex Trendy
► 1000pip Climber
► EA Builder
► StrategyQuant
